Category Archives: observations

Climate indicators

The recent IPCC AR6 WGI report summarises the state of knowledge of physical climate science, but the final version of the Summary for Policymakers (SPM) did not include a figure showing a range of indicators of our warming planet.

An earlier draft of the SPM included a figure like that below which aimed to put recent changes into a longer context of changes over the past 2000 years, and to show how other climate metrics have changed in recent decades. Many of these time series were shown in disparate places of the report, and have been brought together in this updated graphic which also indicates key milestones and discoveries in climate science.

Indicators (from top to bottom): atmospheric carbon dioxide concentration, ocean heat content, global sea level, global mean surface temperature, global lower tropospheric temperatures, Arctic sea ice amount, Kyoto cherry blossom date, specific humidity over land. Key moments in the history of climate science are indicated: the invention of the efficient steam engine by James Watt in 1790, the identification of the primary greenhouse gases by John Tyndall in 1861, the first estimate of climate sensitivity by Svante Arrhenius in 1896, and the discovery that the world was warming by Guy Callendar in 1938.

Continue reading Climate indicators

Adding observations to IPCC figures

The figures in the IPCC AR6 WGI SPM are a huge improvement over previous reports. However, one minor quibble is with the lack of observations shown. This brief post makes a figure available which is based on IPCC AR6 WGI SPM Figure 8, but with some observations added to show how global surface temperature and Arctic sea ice area have varied, compared to the model simulations. In my view this is a scientific improvement over the original version.
Continue reading Adding observations to IPCC figures

Storm Ulysses

On 27th February 1903 a major windstorm hit the UK and Ireland, known as Storm Ulysses.

The 20th Century Reanalysis (20CRv3) includes a modern reconstruction of the storm, created by assimilating available observations of surface pressure into a state-of-the-art weather forecast model.

There is a problem however. The number of available observations over north-west Europe is limited as most have never been digitised from the original hand-written paper sources. Recently, the WeatherRescue.org project rescued millions of observations, allowing us to examine the value of this new data by rerunning 20CRv3 with the new data added.
Continue reading Storm Ulysses

Warming soil temperatures

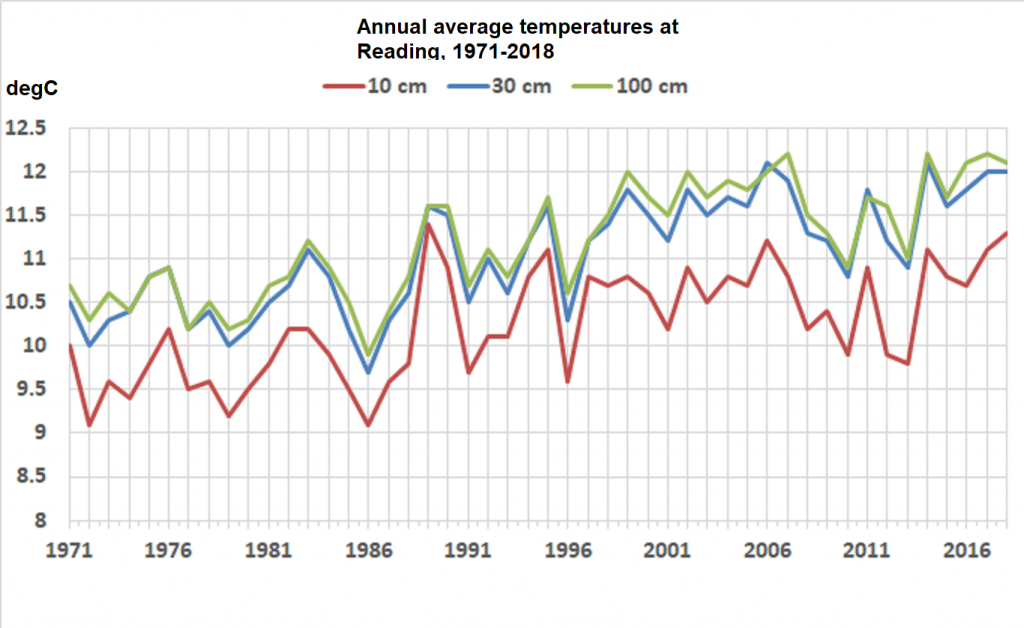
It is not just air and ocean temperatures that are warming through climate change – the soils are warming too. At the University of Reading we have monitored underground temperatures every day since 1971 from 10cm to 100cm depth. There is a clear warming observed at each depth

The time series for 30cm depth can be extended back further to 1941 using observations from nearby sites – Maidenhead, Hurley and an older University campus (London Road*). The variations between overlapping site records are very consistent and more than 1.5°C warming has been observed overall in the last 80 years.

(Added 12th October 2019)
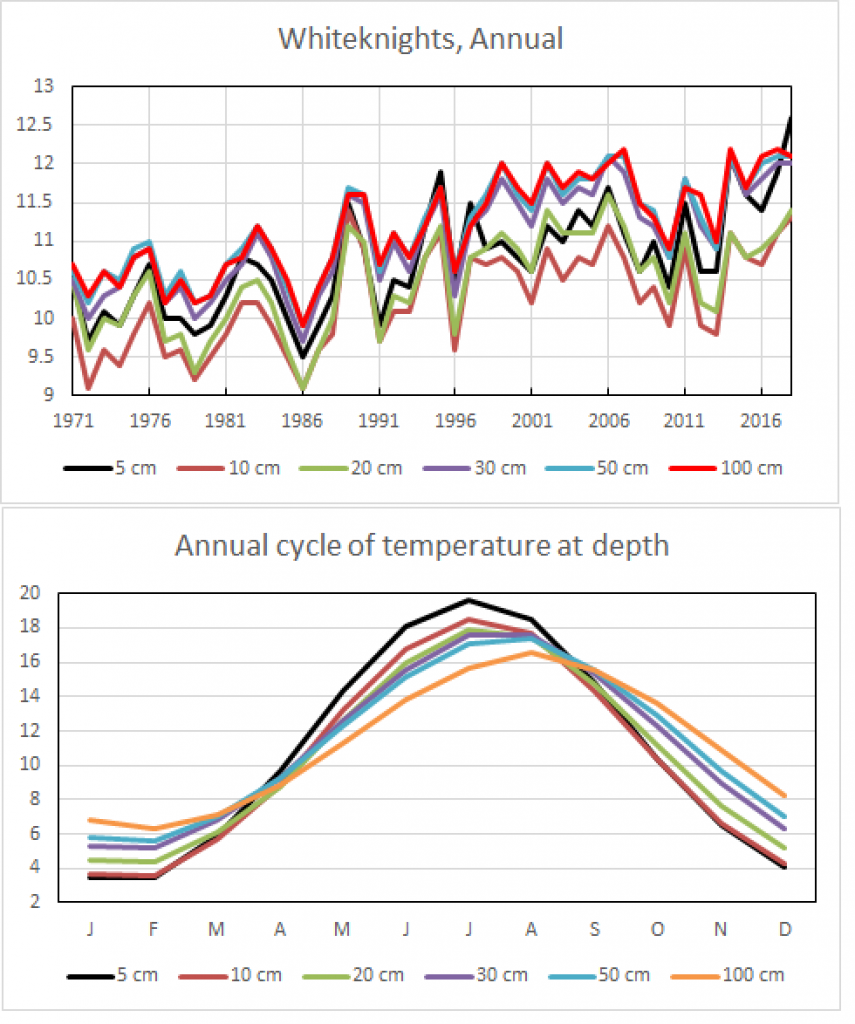
Data for other depths exists also. The seasonal cycle shows how different depths respond to the seasons, with deeper depths being lagged compared to the surface and smaller variations over the year. 10cm depth is coolest in the annual average, with 50-100cm being the warmest.

Graphics and analysis by Roger Brugge, University of Reading.

* Note the London Road campus is about 0.5°C warmer than the other sites, and this difference has been corrected for in the black line.

Climate stripes for the UK

Following the ‘warming stripes‘ graphics for different locations around the world, this post focusses on the UK. The Met Office makes easily available long-running climate data from a small number of locations*. The visualisations below show the common changes in temperature and rainfall for the five longest climate monitoring stations in that set – Stornoway, Armagh, Durham, Sheffield & Oxford – which all have data for 1883-2017. Continue reading Climate stripes for the UK

Trends in extremes

Twenty years ago, the trend in annual mean global mean temperature became detectable. Ten years ago, regional seasonal mean temperature trends were becoming clear. Nowadays, we can see trends even in weather extremes. In this post I show trends in long-term meteorological station data for hot, cold and wet extremes, and share some thoughts on tropical cyclones and droughts. It is underpinned by a decade of studying these around the globe, often in collaboration with the WWA team. I make no claims for completeness: the world is large and complicated, and I simply do not know all the literature.

Guest post by Geert Jan van Oldenborgh
Continue reading Trends in extremes

Uncertainty in warming since pre-industrial times

The consequences of the Paris Agreement’s choice of the pre-industrial as its baseline have been discussed previously on this blog. This choice makes sense from a climate forcing perspective (as radiative forcings are measured with respect to a quasi-equilibrated state, and the well-observed recent past is not close to have finished responding to anthropogenic drivers). Looking back into the pre-industrial period, there are fewer instrumental observations of the temperature across the globe. So naturally our knowledge of the pre-industrial baseline temperature is uncertain.

Recent work, such as Hawkins et al. (2017) and Schurer et al. (2017), have looked to assess and quantify this uncertainty in light of future targets. The magnitude of this uncertainty, although small, becomes important when you consider the amount of warming left between today and the 1.5°C target. Continue reading Uncertainty in warming since pre-industrial times