All posts by Ed Hawkins

About Ed Hawkins

Climate scientist in the National Centre for Atmospheric Science (NCAS) at the University of Reading. IPCC AR5 Contributing Author. Can be found on twitter too: @ed_hawkins

New viridis colour scale

Below is a simple example of using different colour maps to show the same UK mean temperature data for both normal vision and a simulation of colour blindness.

Viridis is a new colour map developed for Python (MATLAB code here) with lots of nice features, including removal of artificial perceptual boundaries which jet suffers from.

Which do you prefer?

UK mean temperature, shown for four different colour scales, for both normal vision (top) and a red-green colour blind simulation (bottom).

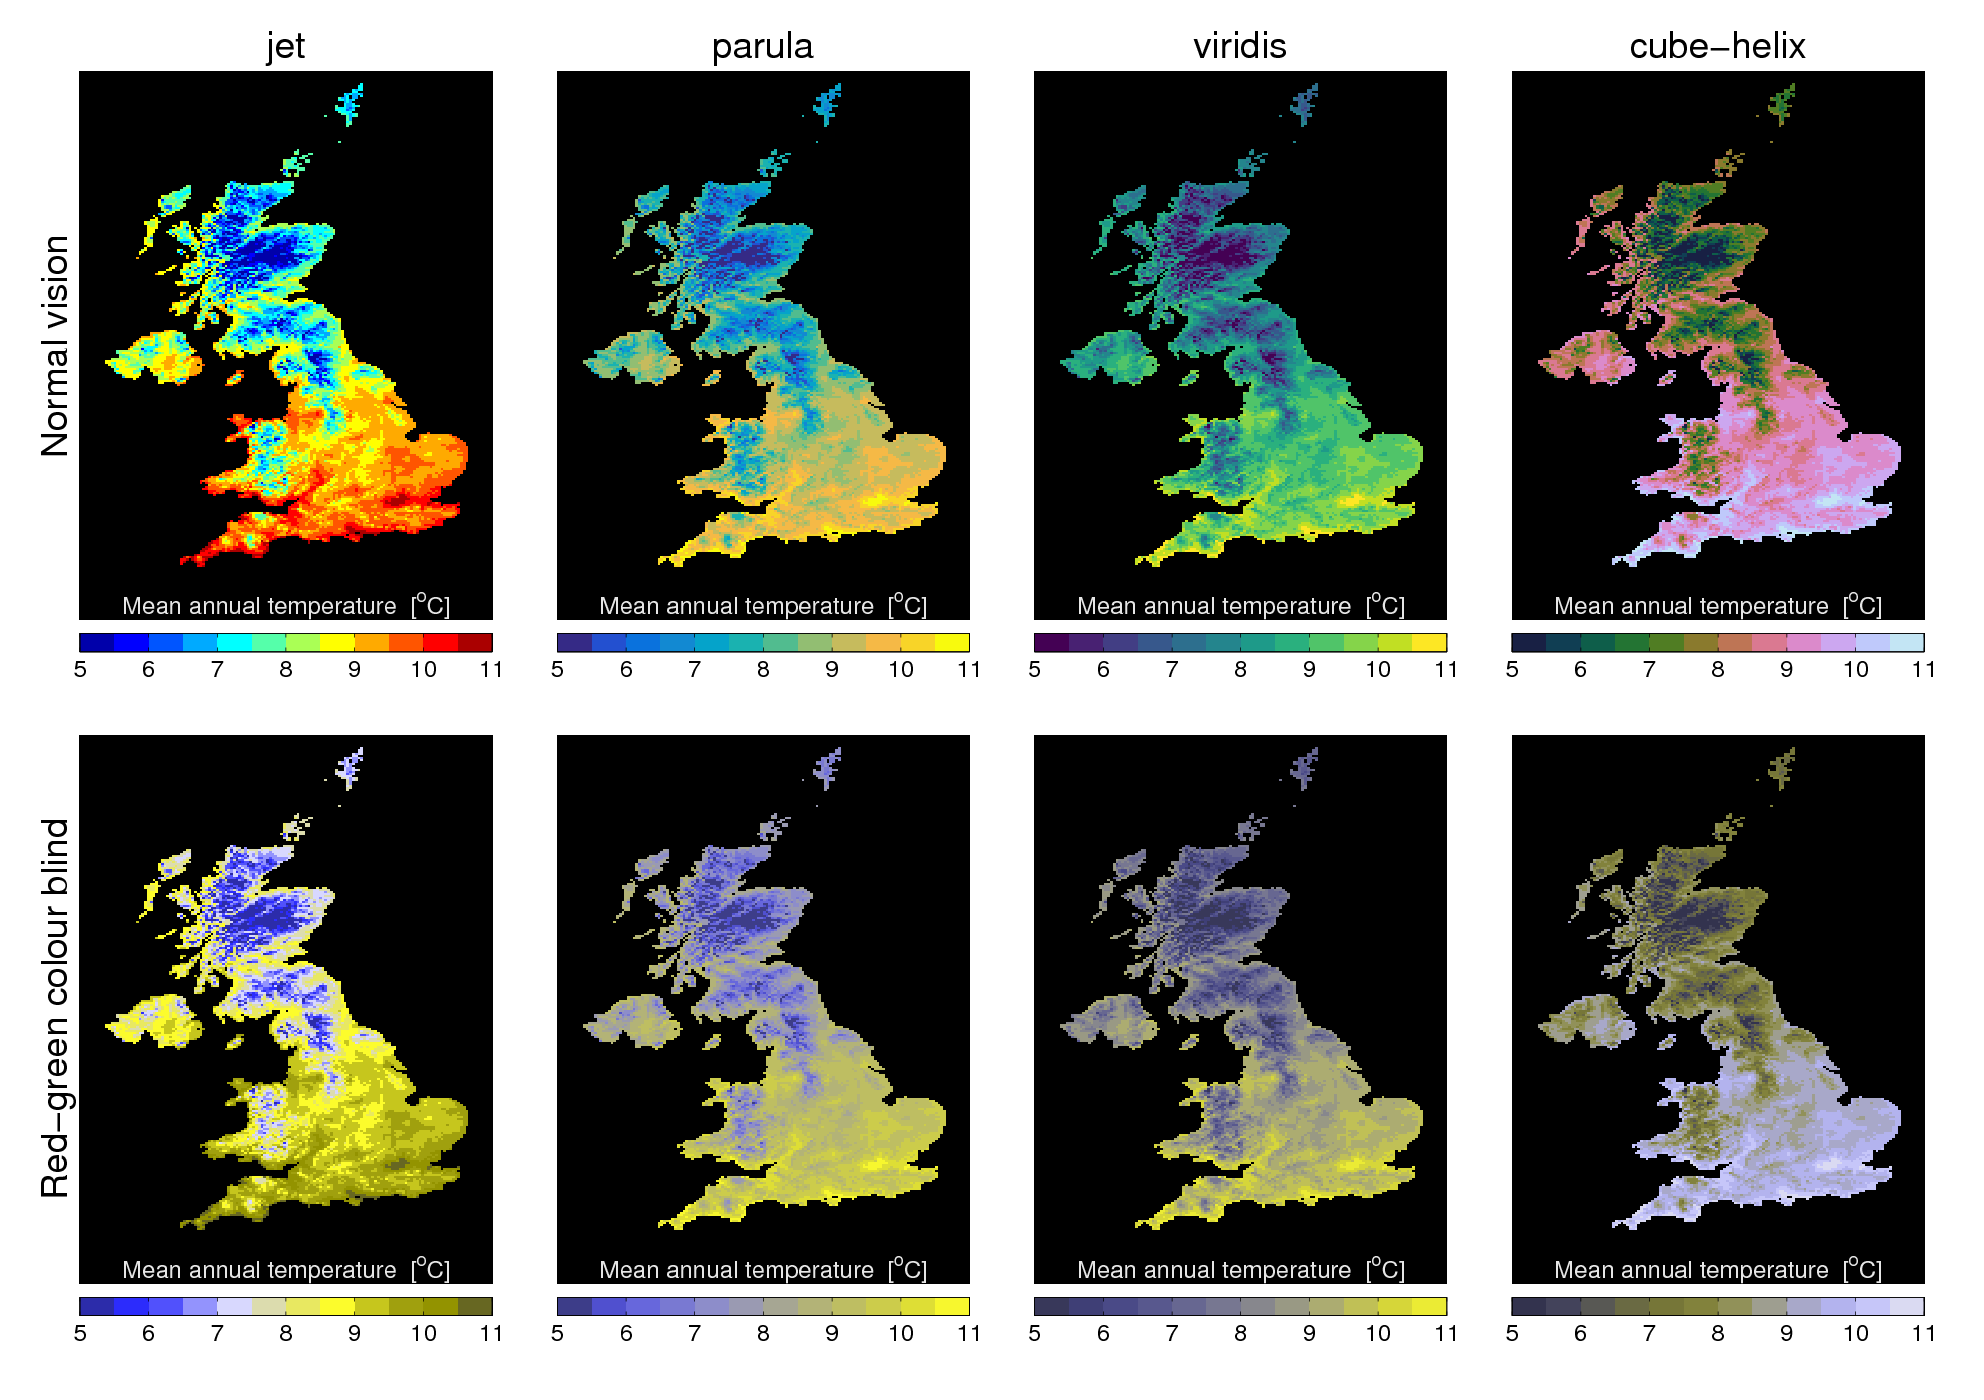
[This post continues our #endrainbow campaign to reduce use of ‘rainbow’ colour scales like jet.]

Extremes of 2014 in review

Was last year really the warmest on record? As soon as NOAA published its official announcement in January, this question invaded the web feeding blogs, online newspapers and forums with passionate discussions. Relevant or pointless? The question is not so much knowing whether or not a new record was broken. Should 2014 rank second or third, this wouldn’t change the big picture: last year, temperatures on our planet continued the existing long-term positive trend. On top of that, the story is a bit thicker than the one single number obtained when averaging near-surface air temperatures in time and space. So, 2014: year of extremes or warm year in a changing climate?

Guest post by François Massonnet, Université Catholique de Louvain, Belgium / Catalan Institute of Climate Sciences, Spain Continue reading Extremes of 2014 in review

A spectrum of global temperature trends

Trends in global mean temperature are not static through time. Changes due to radiative forcings are influenced by internal climate variability. A recent paper by Karl et al. concluded that:

the central estimate for the rate of warming during the first 15 years of the 21st century is at least as great as the last half of the 20th century. These results do not support the notion of a “slowdown” in the increase of global surface temperature.

Are these conclusions, based on comparing a few periods, correct? Continue reading A spectrum of global temperature trends

How not to use daily CMIP5 data for impact studies

A new paper out this week in PLOS Biology uses some CMIP5 simulations of daily mean surface air temperature as part of a larger analysis on the change to future plant growing days. The description of the analysis suggests they have not used the simulations appropriately to arrive at their conclusions. Here I highlight a couple of possible pitfalls in using such data in impact studies. Continue reading How not to use daily CMIP5 data for impact studies

Hiatus delays unprecedented warming rates

Current global temperatures are often discussed in terms of their unprecedented nature when compared to the last few thousand years. An interesting paper in Nature Climate Change by Steven J Smith and colleagues examines the rate of warming projected by the CMIP5 ensemble and suggests that the rate of warming is unprecedented also. However, we note here that their projections are not constrained by the current observations which do not show such strong warming rates at present, and are unlikely to do so in the next few years. Continue reading Hiatus delays unprecedented warming rates