Ideally, we would have observations of past weather everywhere for several centuries to reconstruct the state of the atmosphere and learn about its variability. But, we don’t.
Instead, all the observations ever taken would, ideally, be available digitally for everyone to use. But, they aren’t. Many past observations are buried in hand-written journals and logbooks, gathering dust in libraries and archives all over the world. Rescuing this data would be of great benefit to reconstructing past weather, as this example will show.
There are many projects worldwide which are trying to rescue these historical observations and make them readily available. One of the most successful has been Old Weather, which digitised more than 1.5 million sets of weather observations from UK Royal Naval logbooks from the 1914-1923 period using volunteer ‘citizen scientists’.
Now, the benefit of these observations for reconstructing past weather can be cleanly demonstrated. The ’20th Century Reanalysis’ (20CR) project has combined all the available sea-level pressure observations with a weather forecast model to produce estimates of the past weather everywhere since 1871. And, they have created many different versions of this reanalysis to sample the uncertainty due to the lack of observations in some regions.
Then, the 20CR team repeated the reanalysis adding in just the extra new observations from the oldWeather project to see how this changed the atmospheric reconstruction. [Note that the 20CR data used here is from some test runs performed for this comparison, not the official release.]
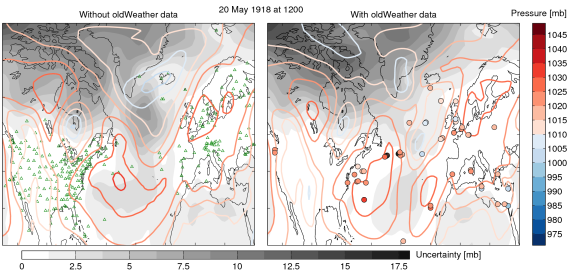
A single example of the benefit of the additional oldWeather observations is shown below for midday on the 20th May 1918 (exactly 96 years before this post was published). The two panels show the sea-level pressure (SLP, coloured contours) and uncertainty (grey shading, or the ‘fog of ignorance’), for the reanalysis with (right) and without (left) the extra observations. The green triangles show previously available observations and the uncertainty around these is low. The coloured circles represent the new oldWeather observations.
The best estimate of SLP has changed markedly in the mid-Atlantic due to adding the extra data. Also, the uncertainty ‘fog’ has reduced in extent and amplitude showing increased certainty in the reanalysis when the oldWeather data is included. This effect is repeated for every day over the 9-year period covered by oldWeather, giving us a much improved reconstruction of past weather variability.
Imagine if we recovered millions more observations?

Note that a more complete animation of this type of improvement is shown in the Brightening the World blog post. And, if anyone is particularly interested in a certain day during 1918 or 1919 this figure can be easily reproduced.
Note that this post was edited slightly on 21/05/14 to clarify my description of the 20CR data as test reanalyses, rather than being from the official release, but this does not change any results.
Acknowledgements: Thanks to Philip Brohan & Gil Compo for supplying the 20CR data and clarifying my terminology, and to the thousands of volunteers who have made oldWeather such an enormous success.