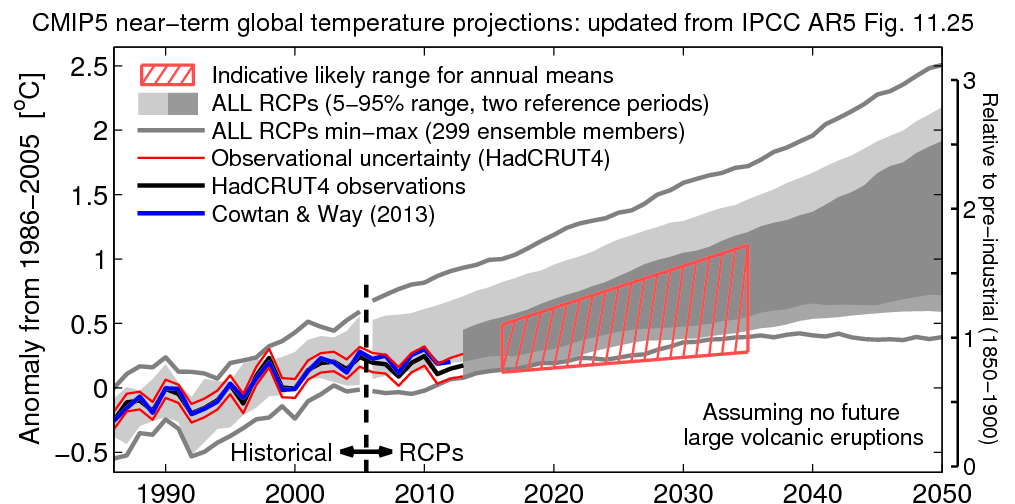
As 2013 is nearly over, it is time for a short update to the comparisons of CMIP5 models and observations for global mean surface air temperatures. Part of the motivation for an update is the Cowtan & Way paper on spatial coverage biases in HadCRUT4, which has been given prominent attention in blogs and the media, notably the front page of The Independent.
The figure below is an updated version of Figure 11.25 from IPCC AR5 which includes the Cowtan & Way data (CW13, blue) and HadCRUT4 data (black, provisional for 2013). The CW13 data shows an increased global temperature trend, and is within the 5-95% uncertainty of the HadCRUT4 observations (red). CW13 is also just within the 5-95% CMIP5 range (light grey).
Overall these updates are fairly minor. This figure will be updated from time to time at this permanent page as new temperature data accumulates.

Ed,
Looking at the trend over the 28-yr period (1986-2013) of your chart, the HadCRUT4 trend falls outside (below) the range containing 95% of the trends from the CMIP5 model runs (historical+RCP4.5) for that period, while the trend through the C&W data falls just a hair inside (at the low end) of the range containing 90% of the model runs.
More details are available in our article “With or without a Pause, climate models still project too much warming.”
-Chip
I am wondering whether the comparison with the uncertainty margin of HadCRUT4. If it has a bias in the trend (which it does by assuming that the trend in the Arctic and interior Africa are equal to the global mean trend), surely that cannot be represented by a constant error band? That represents an error in the mean due to stochastic processes that revert to zero eventually. Just think what the plot would look like in 2100: no random error can represent the discrepency in the trend that has built up over 100 years.
Thank you Geert Jan,
I know very little about statistics, but it seems to me that you have a point about the uncertainty margin of HadCRUT4.
If there are few measurements from the Arctic in HadCRUT4, while other measurements find a high trend in that area, then the uncertainty of the overall mean is questionable and that should affect the overall uncertainty margin of HadCRUT4.
Would you happen to know how to calculate that ?
Rob,
“while other measurements find a high trend in that area”
I thought Cowan & Way provided more extrapolations than more measurements.
They did not find a high trend. A high trend was present in the few actual observations. They merely filled in vacant grid cells with extrapolated values.
The validity of the C&W adjustments to HadCRUT4 relies heavily on the statistics of extrapolation of sparse data into even more sparse areas. Some would say a bridge too far. Similar arguments to the rebuttal of Eric Steig on Antarctic by O’Donnell et al.
Given that it’s essentially unverifiable guesswork, I’m surprised that it is included in HadCRUT4.